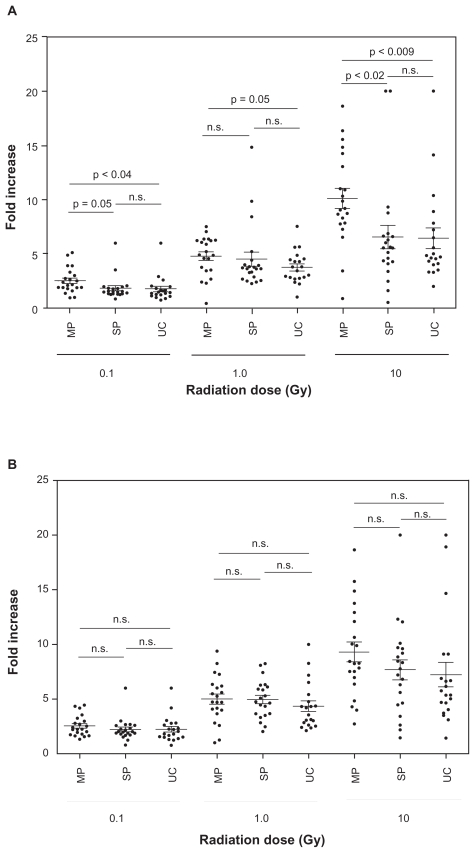
Figure 3. MP versus SP versus UC.
The same data shown in Figure 2 were expressed differently by comparing MP, SP, and UC for each dose of radiation for both CDKN1A A) and BBC3 B), respectively. Symbols are the mean value from each subject, and the bars indicate mean ± standard error of each group. Statistical differences (t-test) were also shown.

