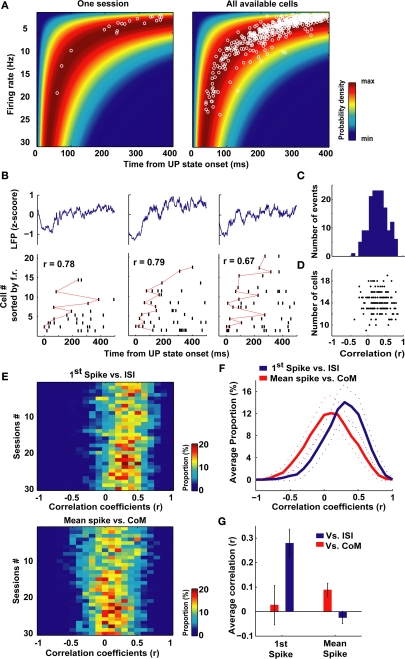
Figure 2.
Cell global activity level is associated with the order of firing. (A) The color plot indicates relative probability density of first spike occurrence for a homogeneous Poisson process as a function of time elapsed (abscissa) and rate of the process. The superimposed white circles show, for each neuron, the session-averaged firing rate during SWS (ordinate) plotted against the averaged latency of first spike occurrence at UP state onset (abscissa). Data are from a representative session (left) and from all cells analyzed (right). (B) Representative raster plots of population firing triggered at three different UP state onsets in a single recording session. LFPs appear above. Cells were sorted, from top to bottom, according to increasing values of session-averaged firing rate. Red lines connect first spikes. (C) Distribution across all recorded neurons of the Spearman correlation coefficients between first spike latencies and average firing rates for all the UP state onsets in which spikes were recorded from each cell. Abscissa is same as (D). (D) Correlation coefficients were not significantly dependent on the number of cells involved in each sequence (r = −0.08, p > 0.05, Pearson correlation). (E) Distributions of the correlation coefficients for first spike latency versus average ISI (left) and mean spike latency versus PETH centers of mass (CoM, right) across all sessions (N = 30). In both cases, for all sessions, the correlations were significantly greater than zero (p < 0.05, t-test). (F) Averages of the distributions displayed in (E), dotted lines display envelope of SD. (G) Average correlation coefficients of the first spike (left), or the mean spike (right) time vs. session-averaged ISI and spike center-of-mass (CoM). The two correlations shown in detail in panels (E,F) were the only two significant and positive ones. There was also a small significant, negative correlation between mean spike latencies and firing rate. Note that the correlation of first spike occurrence versus firing rates is three to four times higher than mean spike times versus PETHs center of mass. Error bars display SD.

