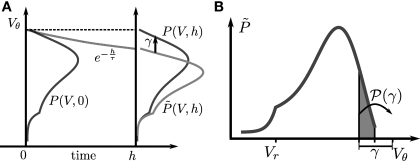
Figure 1.
(A) Evolution of the membrane potential distribution between two adjacent time steps t = 0 and t = h. At the beginning of the interval, the distribution is P(V, 0). Each individual membrane potential in the ensemble then decays exponentially with the membrane time constant τ resulting in a contracted distribution At the end of the interval the synaptic inputs are taken into account which cause a redistribution of the membrane potentials. All membrane trajectories exceeding the threshold Vθ elicit a spike in the interval and the corresponding Vi is reset to Vr. In equilibrium, the distribution after one such cycle is identical to the initial distribution P(V, h) = P(V, 0) again. (B) Boundary condition at the threshold. The neuron receives synaptic inputs during a time step of length h. Their summed effect causes the membrane potential to perform a jump of random size γ with distribution 𝒫(γ). The figure shows one particular realization of γ. For positive γ (as indicated) the shaded area of the distribution is shifted above threshold in this time step and contributes to the firing rate (probability flux over the threshold). Each such contribution is weighted by the probability 𝒫(γ) for the jump γ to occur.

