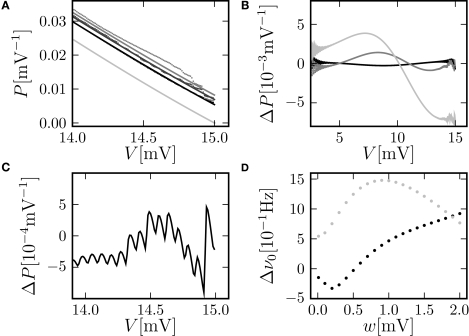
Figure 3.
(A) Membrane potential distribution near threshold for fixed μ = 12. 0 and σ = 5.0 but different synaptic weights (black: w = 0.05 mV, dark gray: w = 0.15 mV, gray: w = 0.25 mV). Numerical solution of the Markov process according to Section “Numerical Solution of the Equilibrium distribution” in Appendix (dotted lines, discretization ΔV = 0.01 mV), analytic solution (Eq. 10) (solid line) and theory in diffusion limit neglecting finite synaptic weights and discrete time (light gray) from Brunel (2000). (B) Deviation ΔP = Pana = Pnum of the analytic membrane potential distribution (Eq. 10) from the numerically obtained distribution from Section “Numerical Solution of the Equilibrium distribution” in Appendix (black: w = 0.15 mV; g = 1.0, gray: w = 0.15, g = 4). Discrepancy between the diffusion approximation (Brunel, 2000) and the numerically obtained solution described in Section “Numerical Solution of the Equilibrium distribution” in Appendix (light gray: w = 0.15 mV, g = 4). (C) Zoom in of (B) for w = 0.15 mV, g = 4. (D) Error of the analytic firing rate (Eq. 14) (black) and of the pure diffusion approximation (light gray) compared to the numerically obtained rate from Section “Numerical Solution of the Equilibrium distribution” in Appendix for different synaptic amplitudes w. Further parameters as in Figure 2A.

