Figure 4.
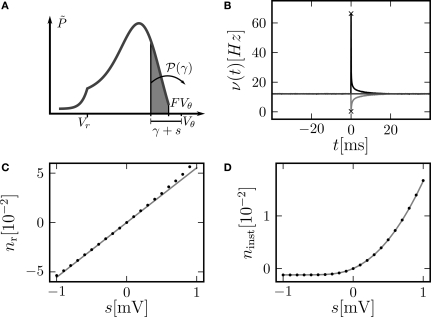
(A) Illustration of the instantaneous firing rate due to a perturbation of size s: During the time bin h, synaptic inputs cause a jump γ of the membrane potential in addition to the perturbation s. The probability mass (shaded area) is shifted above threshold with probability 𝒫(γ) and produces the response of the neuron. Due to the shape of the probability density near the threshold, this area has a linearly [proportional to , area of the rectangular base] and a quadratically increasing contribution [proportional to , area of the triangle] in s. (B) Firing rate as function of time after a perturbation of size s = 0.5 mV (upper trace) and of size s = −0.5 mV (lower trace) in the time bin [0, h). The black crosses denote the analytic peak response given by Eq. 17 for both cases. Solid curves from direct simulation of the response. Parameters as in Figure 2, but incoming synaptic rates νe = 29600 Hz, νi = 5962.5 Hz (corresponding to μ = 11.5 mV and σ = 5.0 mV). (C) Integral response (Eq. 15) (gray) depending on the strength of the perturbation, direct simulation (black dots). (D) Instantaneous response depending on the strength of the perturbation s. Theory using Eq. 17 (gray) and direct simulation (black). Other parameters in (C,D) as in (B).

