Fig. 4.

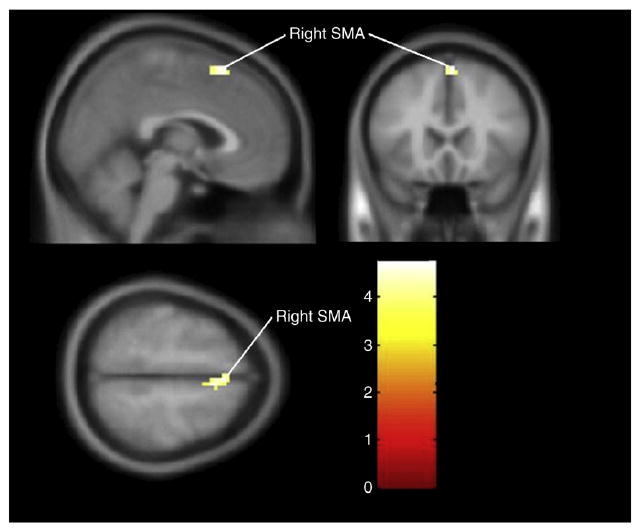
Group differences (MDMA users – non-MDMA users) for Tap 4. Cluster-level significance (p = 0.024, cluster size 38 voxels) in the right supplementary motor area (SMA), (MNI coordinates: 6, 12, 57) with a maximum T-score of 5.18.

Group differences (MDMA users – non-MDMA users) for Tap 4. Cluster-level significance (p = 0.024, cluster size 38 voxels) in the right supplementary motor area (SMA), (MNI coordinates: 6, 12, 57) with a maximum T-score of 5.18.