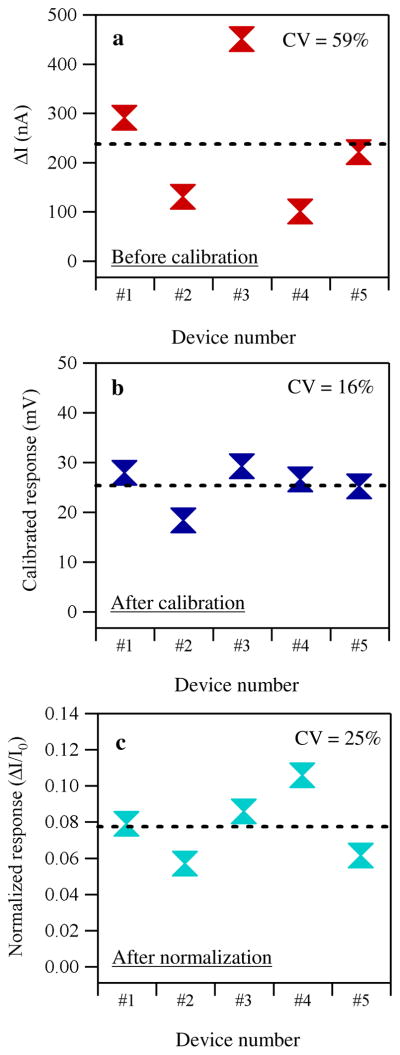
Figure 4.
a) Plots of the absolute responses for five devices versus the device identification number before the calibration. b) Same plots after the calibration. The vertical axis was switched to the calibrated response. c) Same plots after the conventional normalization. The vertical axis is the normalized response.

