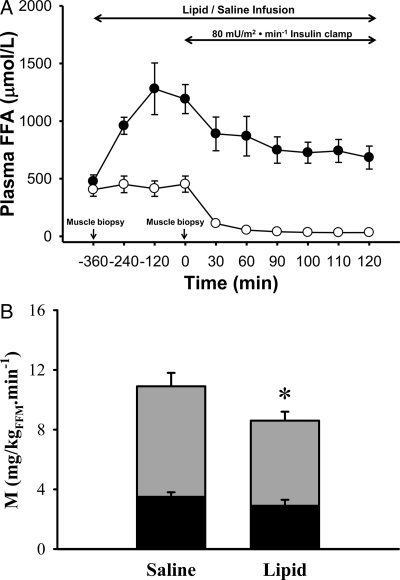
Figure 1.
A, Plasma FFA concentration during lipid (•) and saline (○) infusion study visits; B, insulin-mediated total-body glucose disposal (total height of bars), glucose oxidation (black portion of bars), and nonoxidative glucose disposal, which primarily represents muscle glycogen synthesis (gray portion of bars). *, P < 0.05–0.01, lipid vs. saline infusion.

