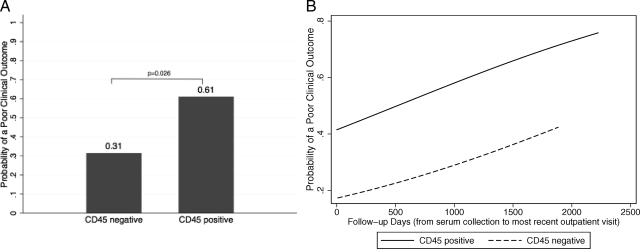
Figure 3.
A, Probability of a poor clinical outcome in patients with CD45-positive cells (11 of 18, 61%) and CD45-negative cells (17 of 54, 31%). B, Probability of a poor clinical outcome, adjusted for adenoma size, increases over time in patients with CD45-positive cells (n = 18, solid line) and CD45-negative cells (n = 54, dashed line).

