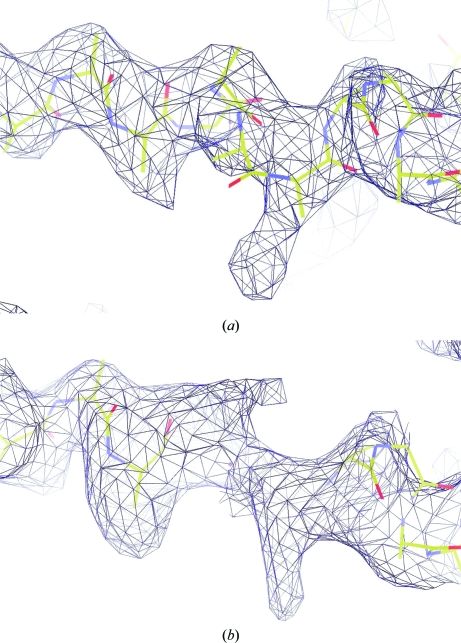
Figure 2.
Electron-density maps showing a helical motif section (bonds shown as sticks, with carbon in yellow, nitrogen in blue and oxygen in red) of S. elodea UgdG (a) from the experimental SeMet-derivative σA map (Read, 1986 ▶) obtained by RESOLVE (Terwilliger, 2004 ▶) after twofold NCS averaging at 3.4 Å resolution and contoured at 2σ (dark blue mesh) and (b) from the molecular-replacement solution obtained by Phaser (McCoy et al., 2007 ▶): a σA OMIT map (Read, 1986 ▶) at 2.4 Å resolution contoured at 1.5σ (dark blue mesh), where four residues of the helical motif were omitted from the model in the map calculation using REFMAC5 (Murshudov et al., 1997 ▶).

