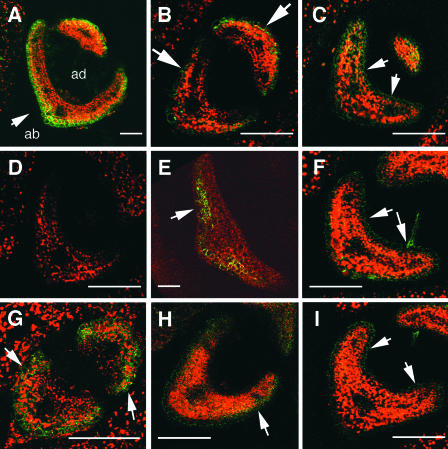
Figure 6.
GFP Expression in Transgenic Plants Carrying the FIL 5′ promoter:GFP.
Transverse sections of young rosette leaves were examined by fluorescence microscopy. Green and red signals indicate GFP and autofluorescence of chloroplasts, respectively; overlapped regions are shown in yellow or orange.
(A) Transverse section of an fp-6 plant indicating that strong GFP expression was detected on the abaxial side (arrow).
(B) In the fp-1.76 plant, a weak GFP signal was expressed on the abaxial side (arrows).
(C) The fp-1.74 plant showed ectopic GFP expression on both the abaxial and adaxial sides. Note the green signal at the adaxial side (arrows).
(D) In the fp-1.5 plant, the GFP signal was not detected.
(E) The mtfp-1 plant showed a weak GFP signal on the abaxial side (arrow).
(F) Weak GFP expression was induced on both the abaxial and adaxial sides in the mtfp-6 plants. Arrows indicate the signal on the adaxial side.
(G) In the C0.3m plant, GFP was detected on the abaxial side (arrows).
(H) The C0.2A plant showed GFP on the abaxial side (arrow). The expression level was weaker than that of the C0.3m plant.
(I) A weak GFP signal was expressed on both the abaxial and adaxial sides in the C0.2B plant. Arrows show ectopic GFP expression on the adaxial side.
ab, abaxial side; ad, adaxial side. Bars = 50 μm.

