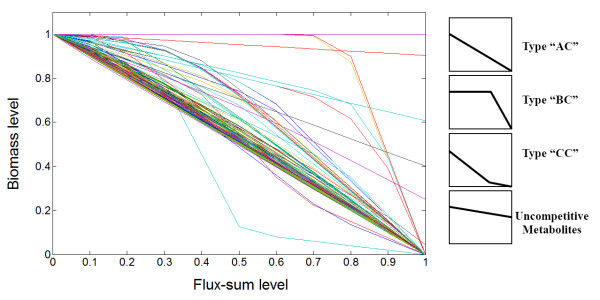
Figure 6.
Flux-sum intensification profile. The horizontal axis corresponds to the value of kint. The vertical axis corresponds to the biomass production normalized with respect to the basal biomass production. Metabolites with profile that intersected the point (1, 0) were competitive metabolites which could be classified as either "AC", "BC" or "CC" with the suffix "C" indicating that it is competitive and the other metabolites are considered uncompetitive.

