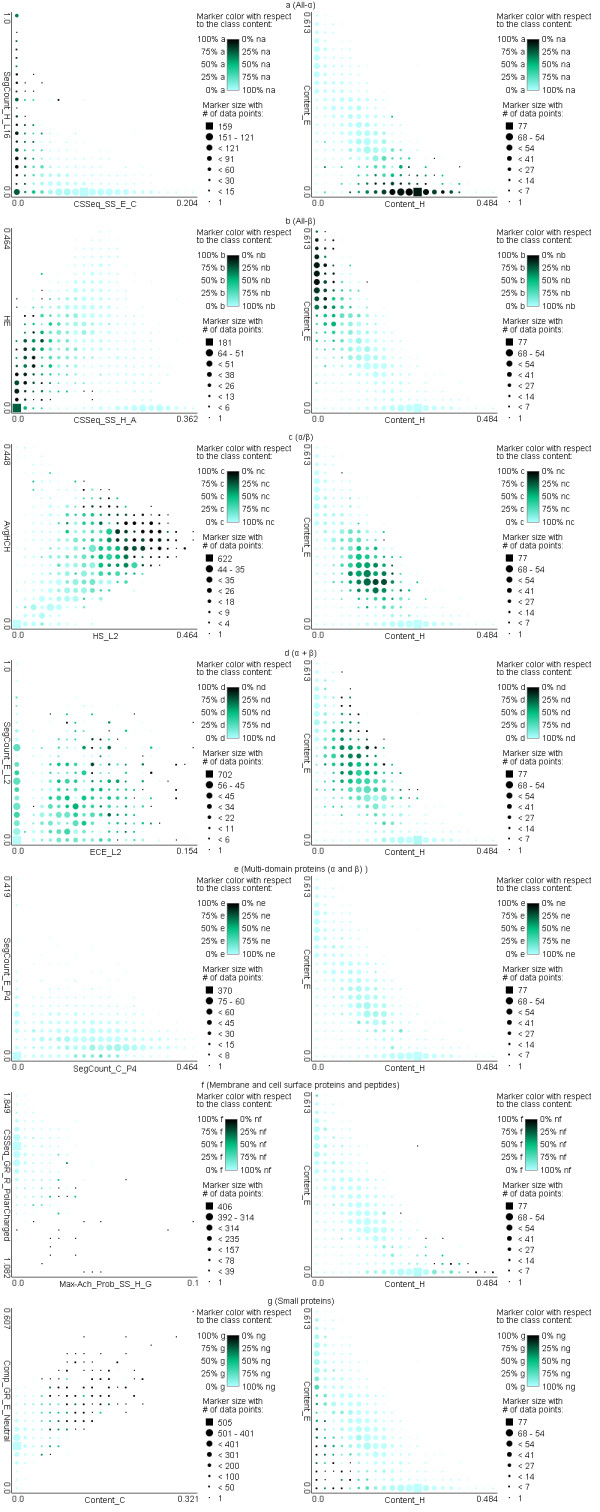
Figure 4.

Scatter plots for two representative features for each structural class (left column) and helix and strand contents (right column) for a) all-α; b) all-β; c) α/β; d) α+β; e) multi-domain; f) membrane and cell surface proteins; and g) small proteins classes. The plots were computed on the ASTRALtrainingdataset and they use markers with colors and shapes that indicate the class and number of protein chains for a given combination of the values of the two features, respectively. The larger the marker is the more chains are found for the corresponding values of the two features. The darker the shading of the marker is the larger the fraction of the chains that correspond to the target class is for the given values of the two features.
