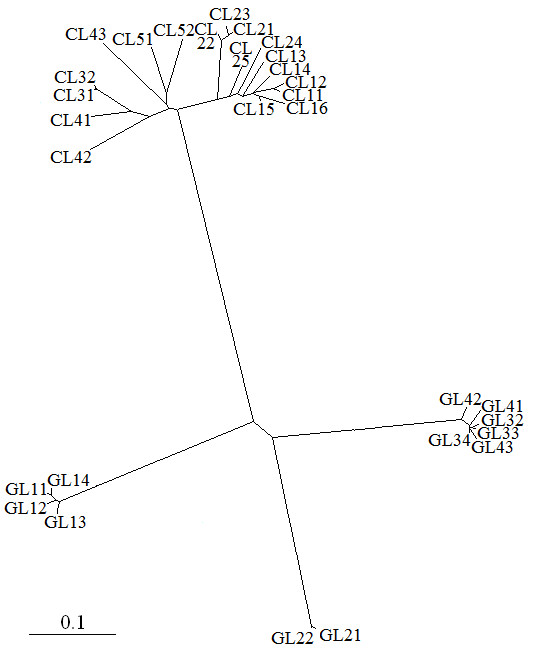
Figure 2.

Phylogenetic analysis of isolated LTRs. Neighbour-joining analysis of alignment of LTRs of H. annuus. Bar represents distance (percent divergence) between all pairs of sequence from the multiple alignments (CL: putative Copia LTR; GL: putative Gypsy LTR).
