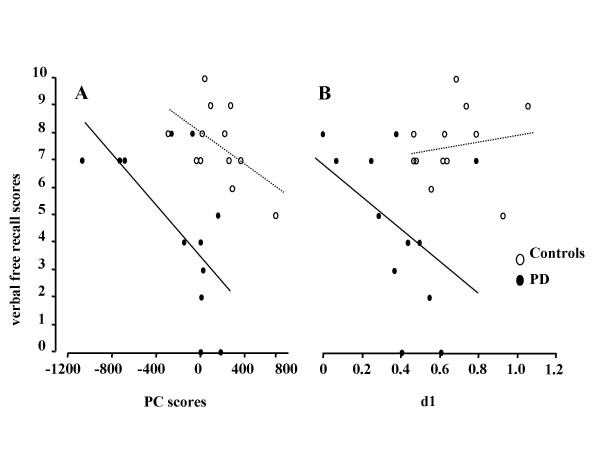
Figure 1.
A. Scatter plot demonstrating significant correlation (p = 0.01) between delayed verbal free recall and PC 7 expression coefficients (=PC scores) in the patient group (filled circles, solid trend line), which were not significantly associated in normal controls (open circles, dotted trend line). B. Correlation between delayed verbal free recall and d1 showed a statistical trend (p = 0.08) in patients, but not in normal controls. Note: overall PC7 expression coefficients are on average significantly lower in patients than in normal controls (p < 0.02, two-tailed unpaired t-test).

