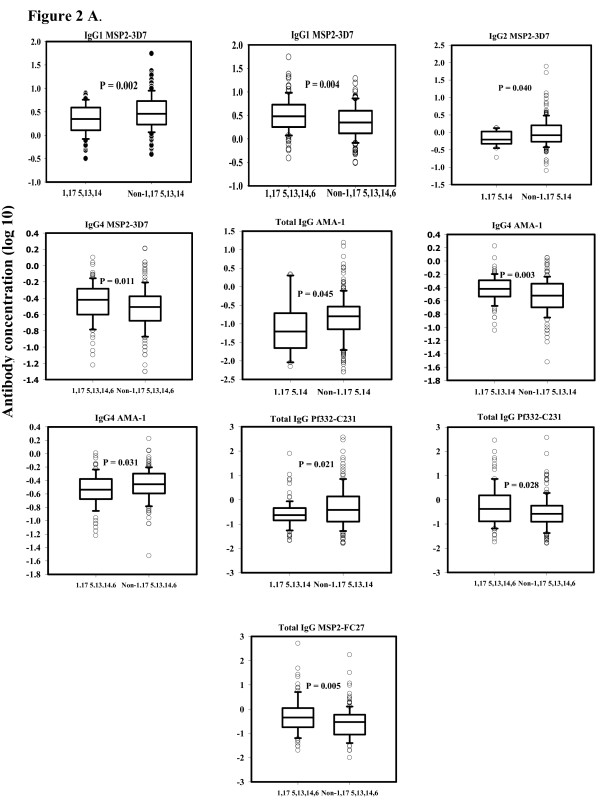
Figure 2.
Concentrations (log 10) of total IgG and IgG isotypes to four antigens: MSP2-3D7, AMA-1, Pf332-C231 and MSP2-FC27. The figure demonstrates the significant differences in levels of the above antibodies between the each of the GM phenotype carriers; 1,17 5,14 - 1,17 5,14,6 - 1,17 5,13,14 - 1,17 5,13,14,6, and the corresponding-phenotype non-carriers.

