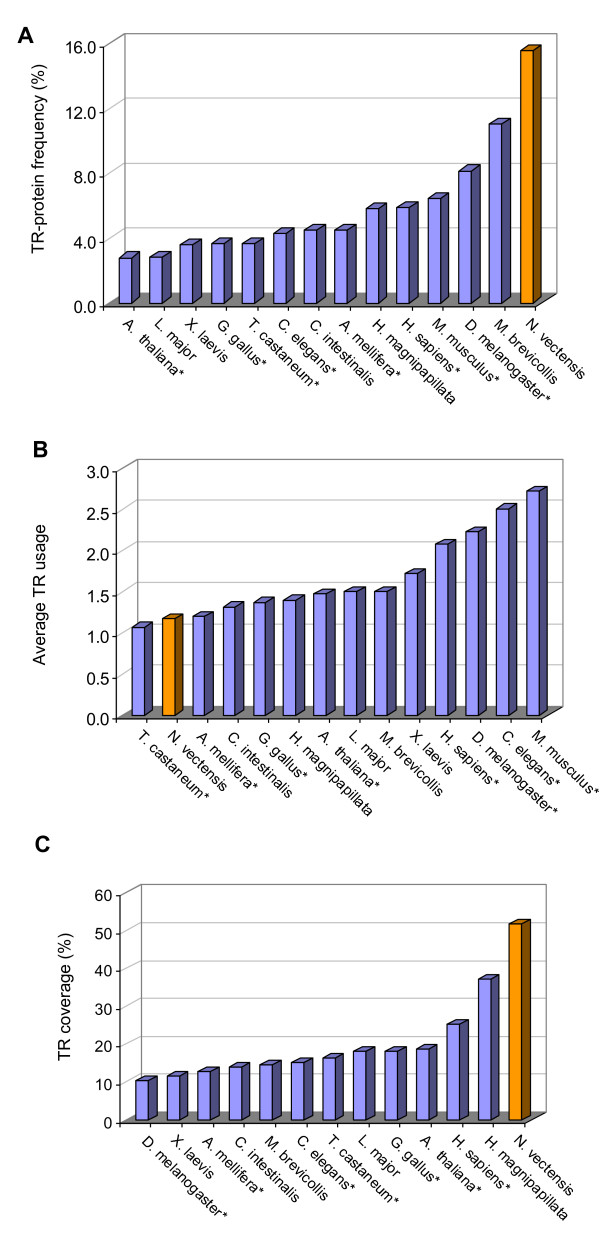
Figure 2.
N. vectensis TRs relative to representative proteomes along the metazoan evolutionary tree. (A) The fraction of TR-proteins within the proteome tested for 14 model organisms. Representative organisms include plant, insects, worm, sea squirt, frog, and more. The relative fraction of TR-proteins in N. vectensis is nearly double that of fly and almost 5 fold higher than the plant representative. (B) The usage of the unique TRs in the proteins. In mouse, worm, fly, and human, on average, each TR is used in >2 distinct proteins. However, for N. vectensis, this ratio is close to one. (C) The length of the TR-segment relative to the length of the protein that contains it (denoted as coverage). The coverage is < 20% in most organisms excluding N. vectensis.

