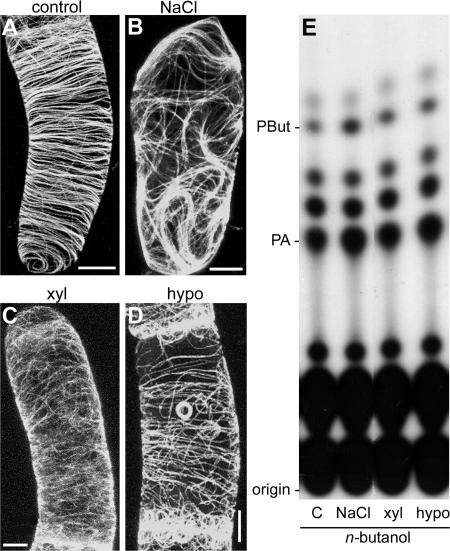
Figure 4.
Effect of Some Other PLD Activators on Microtubules in BY-2 Cells.
(A) to (D) Confocal laser scanning micrographs of GFP-MAP4–transformed interphase cells after treatment with some known PLD activators. These images are maximum projections of 40 confocal slices covering a depth of 15 μm and denoting approximately a hemicylinder of each cell. Bars = 5 μm.
(A) Control.
(B) Osmotic stress (150 mM NaCl).
(C) Fungal elicitor xylanase (100 μg/mL).
(D) Hypoosmotic stress (1:1 dilution with distilled water).
(E) TLC analyses of lipid extracts from 32P-prelabeled cells treated with or without the agonists noted above in the presence of 0.5% n-butanol.

