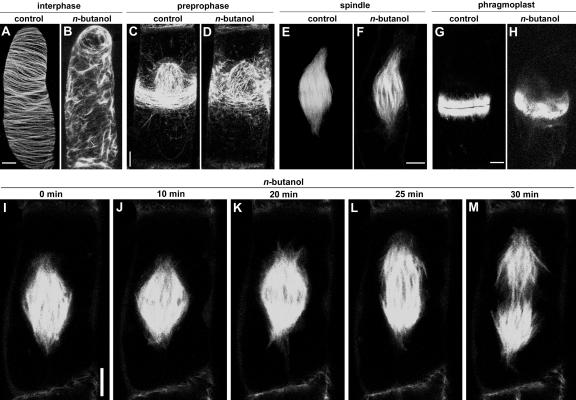
Figure 7.
Effect of n-Butanol on Different Microtubular Arrays in Dividing BY-2 Cells.
(A) to (H) Confocal laser scanning micrographs of GFP-MAP4–transformed BY-2 cells at various stages of the cell cycle recorded after 15 min of treatment with or without 0.5% n-butanol. The effects on interphase cortical microtubules ([A] and [B]), microtubules in the preprophase band ([C] and [D]), spindle microtubules ([E] and [F]), and phragmoplast microtubules ([G] and [H]) are shown. These images are maximum projections of 40 confocal slices covering a depth of almost 20 μm and denoting approximately a hemicylinder of each cell. Bars = 5 μm.
(I) to (M) Confocal laser scanning micrographs of a time-lapse study of spindle microtubules after treatment with 0.5% n-butanol. (I) corresponds to prophase, and (M) corresponds to telophase. The images are single median confocal sections of the cell. Bar = 5 μm.

