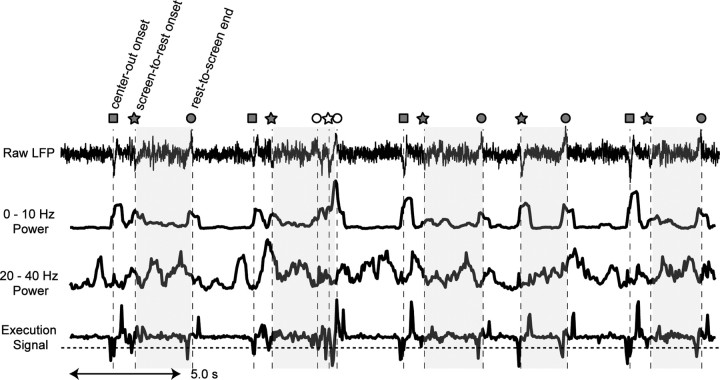
Figure 3.
The execution signal. Rows show an LFP trace recorded for 30 s, its power in the 0–10 Hz band, its power in the 20–40 Hz band, and the corresponding execution signal. Squares represent the movement onset for center-out reaches, pentagons for the movement onset for screen-to-rest reaches, and circles for the movement end for rest-to-screen reaches. The shaded zones are intertrial intervals (rest periods). The open icons represent a specific movement sequence which is referred to in the manuscript. Notice that the execution signal reaches the threshold (dashed horizontal line) much earlier than the event markers for the rest-to-screen reaches as the markers indicated the time when the movement ended instead of started. Meanwhile, the execution signal reaches the threshold closer to the event markers for the other two types of events.

