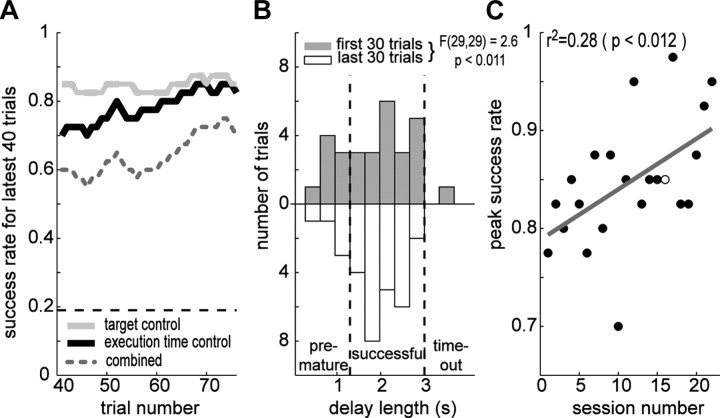
Figure 5.
Performance improvement. A, The behavioral performance over the latest 40 trials during the brain-control session shown in Figure 4. The gray dotted line is the overall performance, black for go detection, and the light gray for target control. The horizontal dashed line indicates the chance level for go detection. B, The distribution of the delay lengths in the brain-control task. The gray and white boxes correspond to the first and last 30 trials in the session. Variance of the two distributions are significantly different (F(29,29) = 2.6, p < 0.05). C, The success rate for the execution state control as a function of the experimental session number. The open circle represents the performance in the session shown in Figure 4. The linear regression to the distribution (gray line) has the significantly positive slope (slope = 0.005, p < 0.05).

