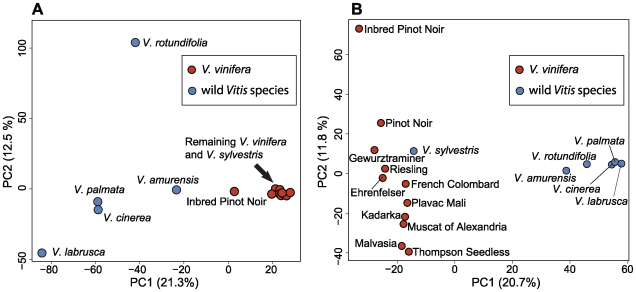
Figure 6. Principal components analysis (PCA) plots from grapevine SNP data.
The first two PCs are shown with the proportion of the variance explained by each PC in parentheses. Panel A shows a PCA plot generated from 14,325 SNPs called from the Illumina GA without regard to segregation pattern. Panel B shows a PCA plot from the Vitis9KSNP array data, whose SNPs were chosen purposely to distinguish among V. vinifera cultivars.

