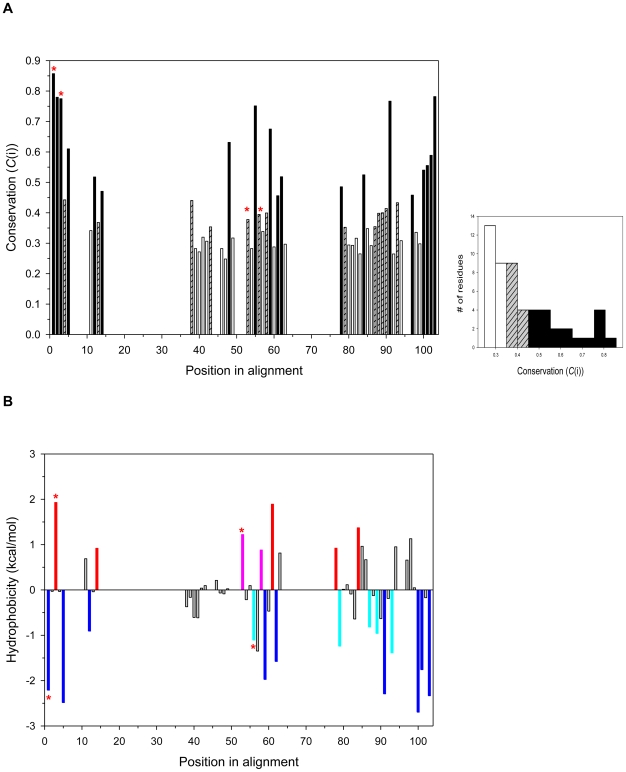
Figure 3. Sequence conservation analysis of the CID.
(A) The figure shows the distribution of conservation scores (C(i)). Positions with high conservation are represented by black bars (C(i)≥0.45), positions with moderate conservation by grey hashed bars (0.35≤C(i)<0.45), and positions with less conservation by white bars (C(i)<0.35). The conservation values of the positions with more than one gap in the alignment are calculated as zero. Right insert shows the histogram of conservation in terms of the number of positions. Bars annotated with red stars are the conserved residues which may interact with the substrate. (B) The figure shows the average hydropathy profile analysis in the superfamily. Highly conserved hydrophobic positions are represented by blue bars and moderately conserved positions by light blue bars. Highly conserved hydrophilic positions are represented by red bars and moderately conserved positions by pink bars.

