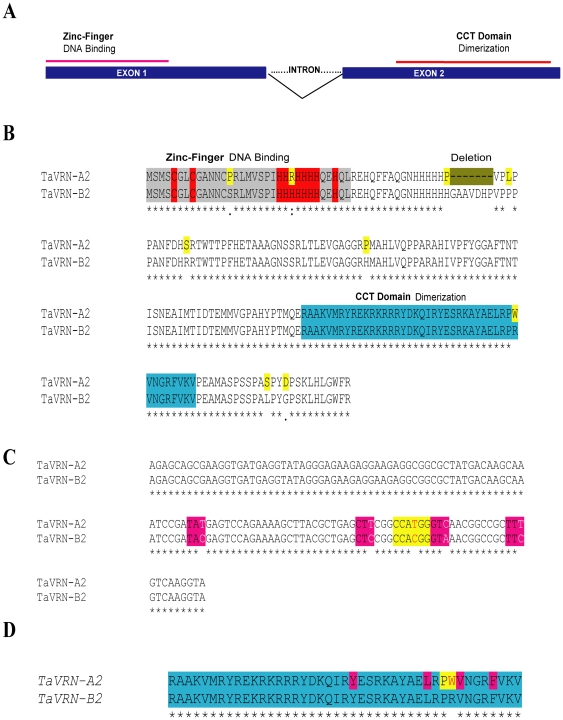
Figure 1. TaVRN2 structure analysis.
A) Gene structure showing the two exons and one intron. Exon1 contains the zinc finger domain and exon2 contains the CCT domain. B) The alignment of TaVRN-A2 and TaVRN-B2 proteins. Regions of putative zinc finger highlighted in red, CCT domains highlighted in blue and difference of nine amino acids highlighted in yellow. C) The alignment of CCT domain of the two copies of TaVRN2 showing their different SNPs (in white and red). The sequence highlighted in yellow in the TaVRN-A2 corresponds to NcoI restriction site. D) Proteins alignment of CCT domain, Alignments are done by using Clustal W program from the web.

