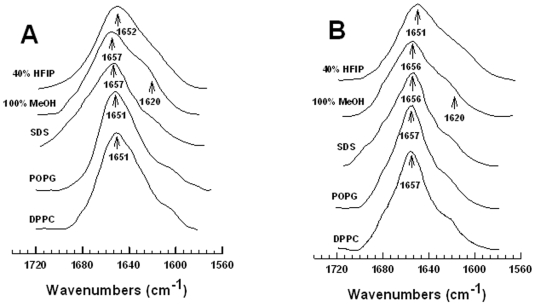
Figure 3. ATR-FTIR spectra of MB and S-MB in the structure-promoting solvents hexafluoroisopropanol (HFIP) and methanol (MeOH), the detergent lipid SDS and the phospholipids POPG and DPPC.
Panel A: Stacked FTIR spectra of MB in 40% HFIP (i.e., 40% HFIP/60% deuterated sodium phosphate buffer, pH 7.4), 100% MeOH (i.e., 100% methanol), deuterated SDS, POPG and DPPC. Panel B: FTIR spectra of S-MB in 40% HFIP, 100% MeOH, SDS, POPG and DPPC. In Panels A and B, the IR spectra for MB and S-MB each show dominant α-helical components centered at 1657–1651 cm−1 (arrows), with minor bands at ∼1637–1613 cm−1 (arrow at 1620 cm−1 ) denoting β-sheet. Peptide concentrations were 470 µM for solvent spectra and 10:1 lipid:peptide (mole:mole) for lipid spectra. The abscissa (left to right) is 1740–1560 cm−1, while the ordinate represents absorption (in arbitrary units). See text for discussion.

