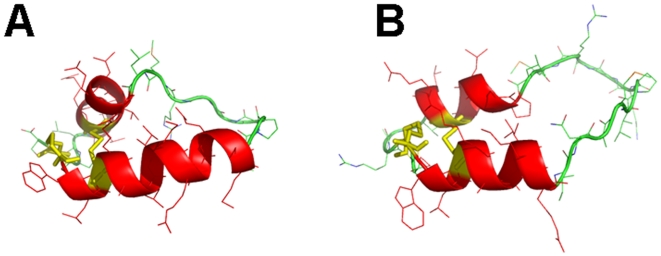
Figure 4. The evolving 3D model of monomeric Mini-B (MB) in 40% HFIP/60% water at the starting (“0 nsec”) and ending (“100 nsec”) times of the molecular dynamics (MD) simulation.
Plate A: Snapshot of MB at “0 nsec”. DSSP analysis indicated the following secondary conformation map (residues in parentheses): coil (8, 22, 26–27, 29, 39–41); turn (23–24, 37–38); bend (25, 28); and α-helix (9–21, 30–36) (see text). Plate B: Snapshot of MB at “100 nsec”. DSSP analysis indicated the following conformation map (residues in parentheses): coil (8–9, 18–24, 28–29, 39–41); bend (25–27, 37–38); and α-helix (10–17, 30–36). In Plates A and B, MD simulations were performed in the GROMACS version 3.3.3 environment (see Methods ). The protein backbone structure is shown with color-coded ribbons denoting the following domains: N-terminal helix (red), turn-loop (green), and C-terminal helix (red) rendered with PyMOL v0.99. Appropriately colored sidechains are shown as stick figures attached to either the helix (red) or loop (green) ribbon backbones. The orientations of MB in Plates A and B are the same as that for MB in Fig. 2B, with the N-terminal Cys-8 at the far-left bottom. Disulfide linkages between the N-terminal helix in the foreground and C-terminal helix in the background are highlighted in yellow.

