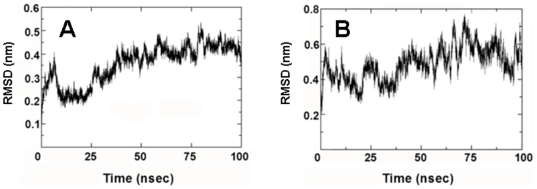
Figure 5. Conformational drift indicated as α-C root mean square deviation (RMSD) from the starting structure for the MD simulation of the monomeric MB and S-MB peptides.
Plate A: Time course of the RMSD in nm from the “0 nsec” structure of MB (Fig. 4A). Plate B: Time course of the RMSD from the “0 nsec” structure of S-MB (Fig. 7A). See Methods for experimental details.

