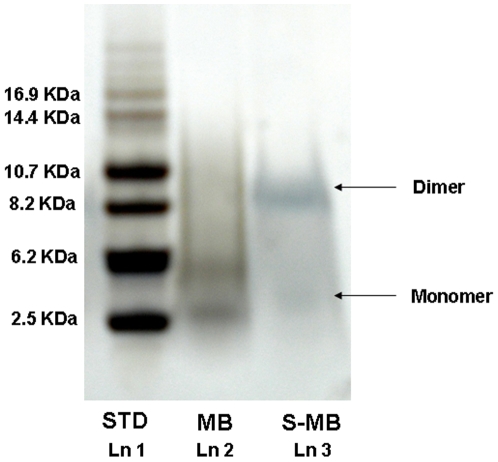
Figure 8. SDS-PAGE analysis of S-MB and MB peptides.
Lane 1 (Ln 1): Molecular mass markers (in kDa). Lane 2 (Ln 2): MB, 4 µg. Lane 3 (Ln 3): S-MB, 4 µg. Arrows to the right of Lane 3 indicate the predicted, approximate positions of the respective monomer and dimer bands for MB and/or S-MB. See Methods for additional details.

