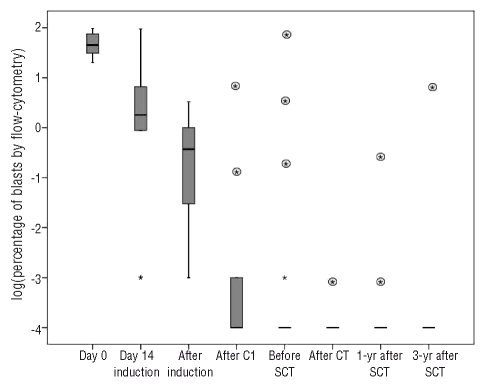
Figure 3.
Progression of MRD of individuals as assessed by flow cytometry. Values are expressed on a logaritmic scale and negative values set at minus 4. Boxes represent medians and quartiles; dots represent patients with outlier values. Rounded asterisks represent values for individual patients who relapsed after that control. Out of eight patients in sustained complete remission only one had positive flow cytometry in a pre-SCT evaluation and none was positive in any post-SCT controls.

