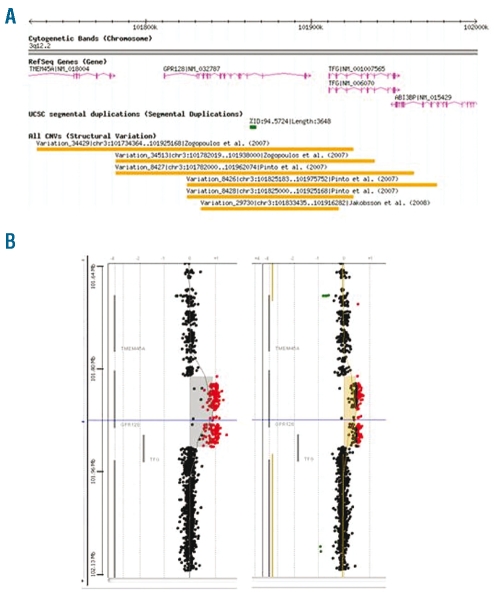
Figure 5.
Variability of the TFG-GPR128 CNV region. (A) Previously published SNP array data demonstrated apparently variable CNV boundaries (from the Database of Genomic Variants). (B) Hybridization of ten TFG-GPR128 positive samples identified by Pinto7 to a custom Agilent 44K array (1100 probes targeted to lie within a 500 kb region centered on the TFG-GPR128 CNV) showed identical breakpoints with either two copies (left-hand array, eight cases) or one copy (right-hand array, two cases) of TFG-GPR128 with no evidence of adjacent CNV. Signal intensities are plotted on the x-axis as log2 ratio.

