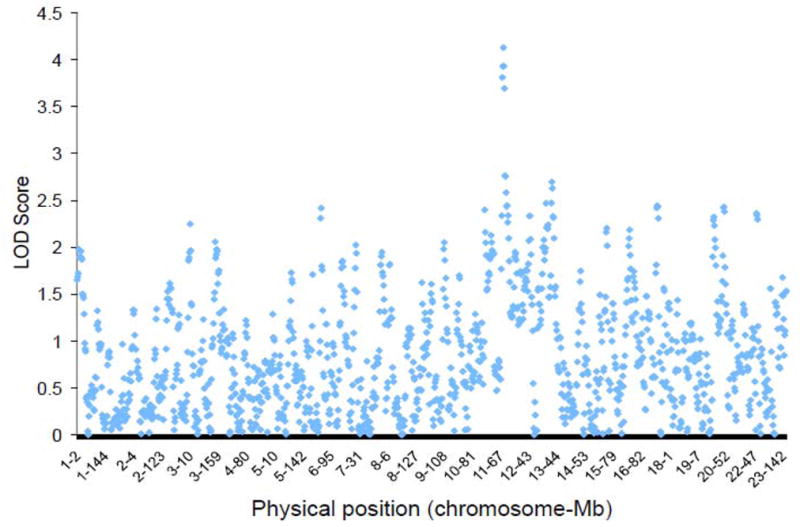
Figure 2.

LOD scores of ANCESTRYMAP analyses describing associations between SNP’s and dichotomized AAI phenotype. Each point represents a singe SNP. LOD score of 3.2 is estimate of minimum threshold for suggested association in this analysis.

LOD scores of ANCESTRYMAP analyses describing associations between SNP’s and dichotomized AAI phenotype. Each point represents a singe SNP. LOD score of 3.2 is estimate of minimum threshold for suggested association in this analysis.