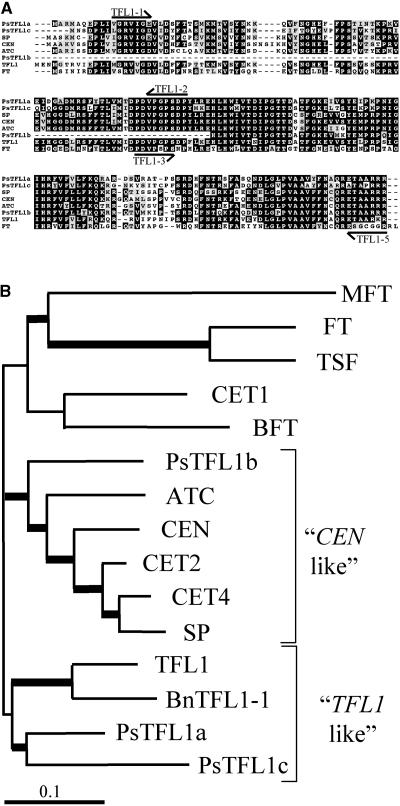
Figure 2.
Comparison of Pea TFL1 Homologs with TFL1 Related Genes.
(A) Alignment of the predicted amino acid sequences of PsTFL1a, PsTFL1b, and PsTFL1c, TFL1 (Bradley et al., 1997), SP (Pnueli et al., 1998), CEN (Bradley et al., 1996), ATC (Mimida et al., 2001), and FT (Kardailsky et al., 1999; Kobayashi et al., 1999). The alignment was performed with Multialign software (Corpet, 1988). Arrows represent the positions of the degenerate primers used to isolate the TFL1 homologs in pea.
(B) Phylogenic tree of TFL1-related proteins constructed using the NJ method with the program CLUSTAL W. Branches with a bootstrap value of >600 (of 1000) are shown with thick lines. In addition to the proteins shown in (A), TSF, BFT, MFT, CET1, CET2, and CET4 from tobacco (Amaya et al., 1999) and BnTFL1-1 from Brassica napus were included in the analysis.

