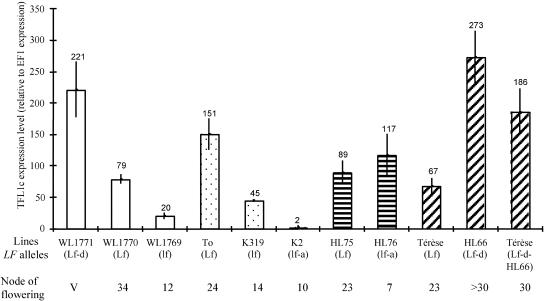
Figure 8.
Analysis of the PsTFL1c Transcript Level in Different LF Lines by Real-Time PCR.
RNA was extracted from the apices of plants at the five-node stage. To compare the results, transcript levels also were evaluated for the elongation factor, E1Fα, which is supposed to be constant in our conditions. Numbers represent the differences in expression between PsTFL1c and EF1α. The real-time PCR experiment was repeated three times. For each LF line, the allele at the LF locus and the node of flowering (average of four different plants grown in short-day conditions) are given. V indicates that the plants did not flower after 40 nodes and remained vegetative.

