
Figure 1. Laser axotomy and imaging of peripheral axon regeneration.
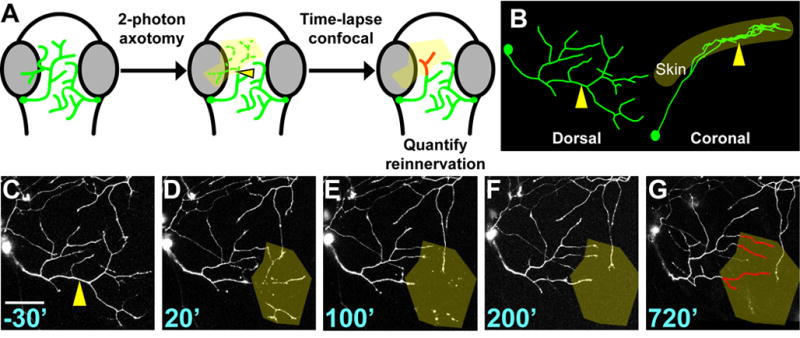
(A) Experimental design. Dorsal view of zebrafish embryo head; eyes are grey, trigeminal axons are green. Arrowhead indicates site of axotomy in all panels. Axon regeneration was monitored by time lapse for ≥ 12 hours and reinnervation of the denervated territory (yellow shading) by new axon growth (red) was calculated. (B) Dorsal and lateral views of a trigeminal axon reconstructed in 3-D. The axon arborizes within a mostly 2-D plane. (C–G) Time series of confocal image stacks. Same axon as in 1B. Time stamps are in minutes relative to axotomy at 30 hpf. Olive shading highlights the denervated region. Scale bar = 50 μm. See Movie S1.