
Figure 2. The capacity for reinnervation diminishes during development.
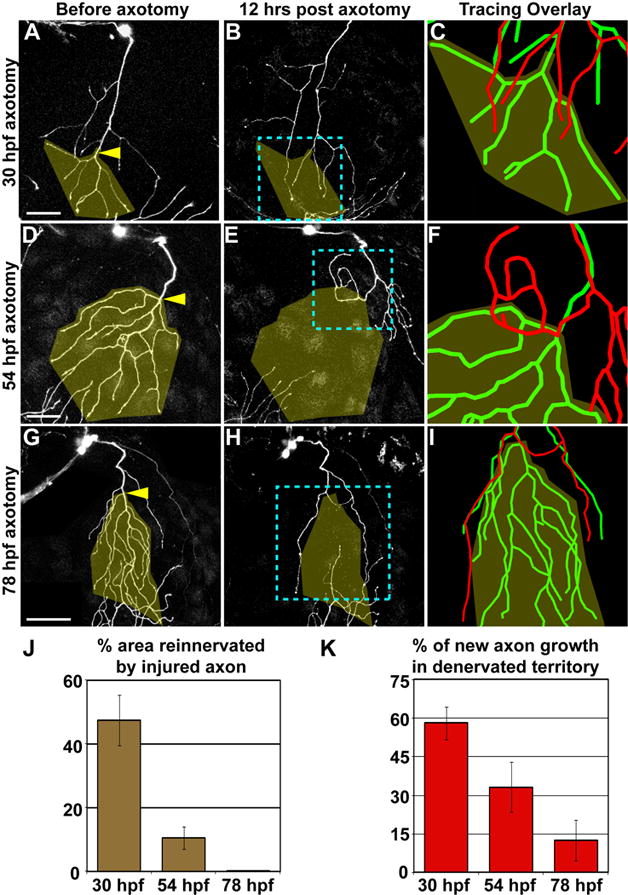
Axotomy at 30hpf (A–C), 54 hpf (D–F), or 78 hpf (G–I). Left two columns are confocal projections. Scale bars = 50 μm. Yellow arrowheads indicate site of axotomy, and olive overlay marks the territory that was denervated after axotomy. Blue dashed boxes indicate the area represented in rightmost panels (C, F, I), which show 3-D reconstructions of the same axon before axotomy (green) and 12 hours after axotomy (red), aligned at the shared branchpoint most proximal to the axotomy site. (J) Quantification of the average area reinnervated by injured axons, calculated as surface area of regenerated axon in denervated territory/surface area of denervated territory. (K) Quantification of average new axon growth that entered the denervated territory, calculated as length of new growth in denervated region/total length of new growth. Error bars ± S.E.M. See Table S1 and Movies S2–S4.