
Figure 3. Developmental regulation of territory reinnervation strategy.
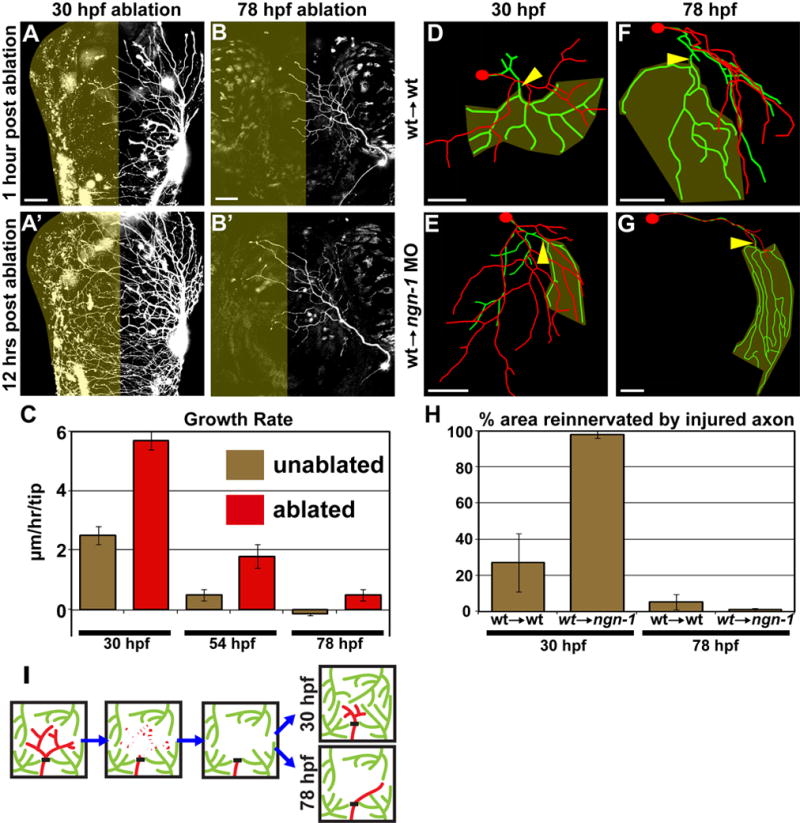
(A–C) Growth potential of uninjured axons is developmentally regulated. (A and B) Confocal projections. Dorsal view of zebrafish head, anterior up. Olive indicates denervated half of head. Scale bars = 50 μm. Ablation of the left trigeminal ganglion at 30 hpf (A) or 78 hpf (B). (C) Quantification of axon growth rate in unablated (olive) vs. ablated (red) animals. Values are the average growth in μm per hour of individual branch tips. Error bars ± S.E.M. See Table S3 and Movies S5–S6. (D–G) Examples of control axons (wildtype cells transplanted into wildtype host) axotomized at 30 hpf (D) or 78 hpf (F), compared to isolated regenerating axons (wildtype cells transplanted into ngn-1 morphant host) axotomized at 30 hpf (E) or 78 hpf (G). Tracing overlays as in Figure 2. Arrowhead is site of axotomy, olive marks denervated territory, and scale bars = 50 μm. (H) Quantification of the area reinnervated by the injured axon, calculated as in Figure 2J. Error bars ± S.E.M. See Table S1 and Movies S7–S10. (I) Model of the developmental regulation of skin reinnervation by the terminal arbors of peripheral sensory axons. Black bar indicates site of axotomy. Injured axons are red, uninjured axons are green.