Fig. 1.

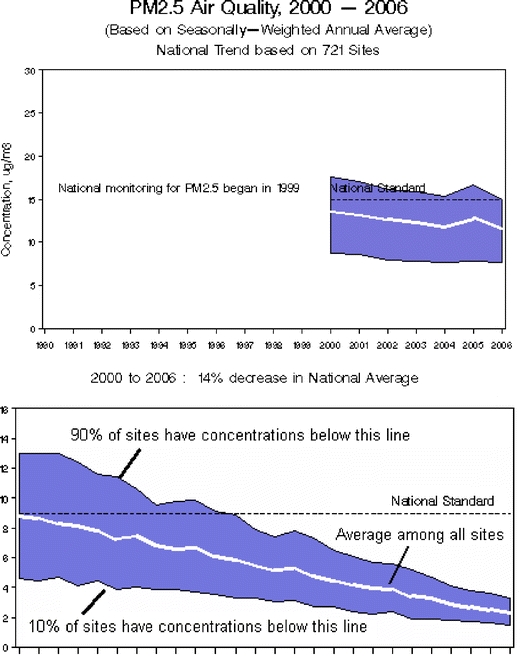
U.S. Environmental Protection Agency (USEPA): trends in particulate matter with a diameter of 2.5 μm (PM 2.5) (Available at: http://www.epa.gov/air/airtrends/pm.html). Top panelNational trends in particulate matter levels. Using a nationwide network of monitoring sites, the Environmental Protection Agency (EPA) has developed ambient air quality trends for particle pollution, also called PM. Trends from 1990 to 2007 are shown here for PM2.5 and PM10. Under the Clean Air Act, EPA sets and reviews national air quality standards for PM. Air quality monitors measure concentrations of PM throughout the country, and the EPA, state, tribal, and local agencies use that data to ensure that PM in the air is at levels that protect public health and the environment. Nationally, average PM concentrations have decreased over the years. For information on PM standards, sources, health effects, and programs to reduce PM, the reader is referred to: www.epa.gov/air/particlepollution. Bottom panel How to interpret the graphs. The blue band shows the distribution of air pollution levels among the trend sites, displaying the middle 80%; the white line represents the average among all the trend sites. In all, 90% of sites have concentrations below the top line, while 10% of sites have concentrations below the bottom line
