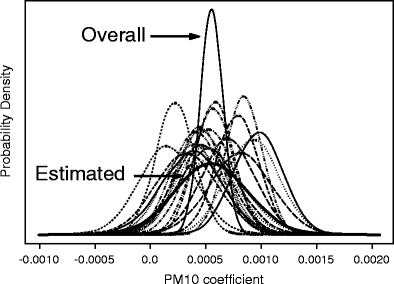
Fig. 7.

Probability densities of PM10 shrunken coefficients for mortality in each of the 21 cities and resulting estimated mixture distribution from all cities. Also shown is the probability density of the pooled over all cities (using random effects model) coefficient
