Figure 3.
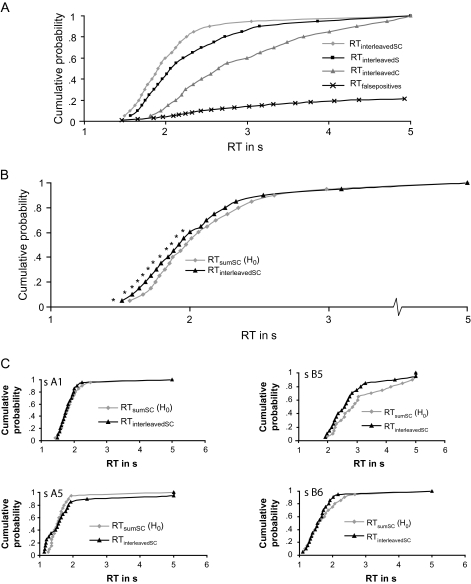
Cumulative probability density functions for the observed sucrose–citral mixtures (gray diamonds), the sucrose stimulus (black squares), and the citral stimulus (gray triangles) averaged over subjects (in panel A). In panel A, we also plotted the pooled (across subjects) false-positive responses to the water stimulus (black crosses). In panel B, we reproduced the observed sucrose–citral mixtures (black triangles) and added the predicted model of independent activation and probability summation (gray diamonds) averaged over subjects. Panel C gives a sample of data of individual subjects (averaged over trials) CDFs. Significant differences (at α = 0.05) are indicated with an asterisk.

