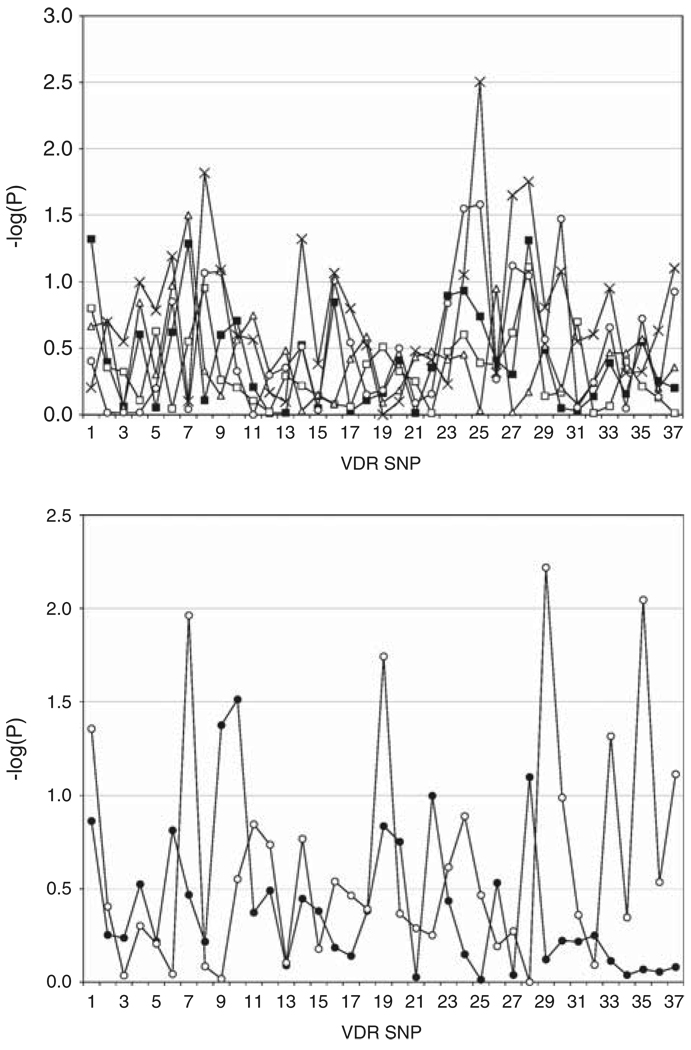
Figure 1.
Sib-pair families were stratified according to the affected sibs’ status at MHC (a) or gender (b). The pedigree disequilibrium test (PDT) results were determined for all 38 SNPs and converted to −log P-values. (a) HLA subgroups: all sibs (filled squares); DR3/4 sibs (open squares); DR3/X sibs (open circles); DR4/X (open triangles) and DRX/X (crosses). (b) Subgroups by gender: females (filled circles), males (open circles).

