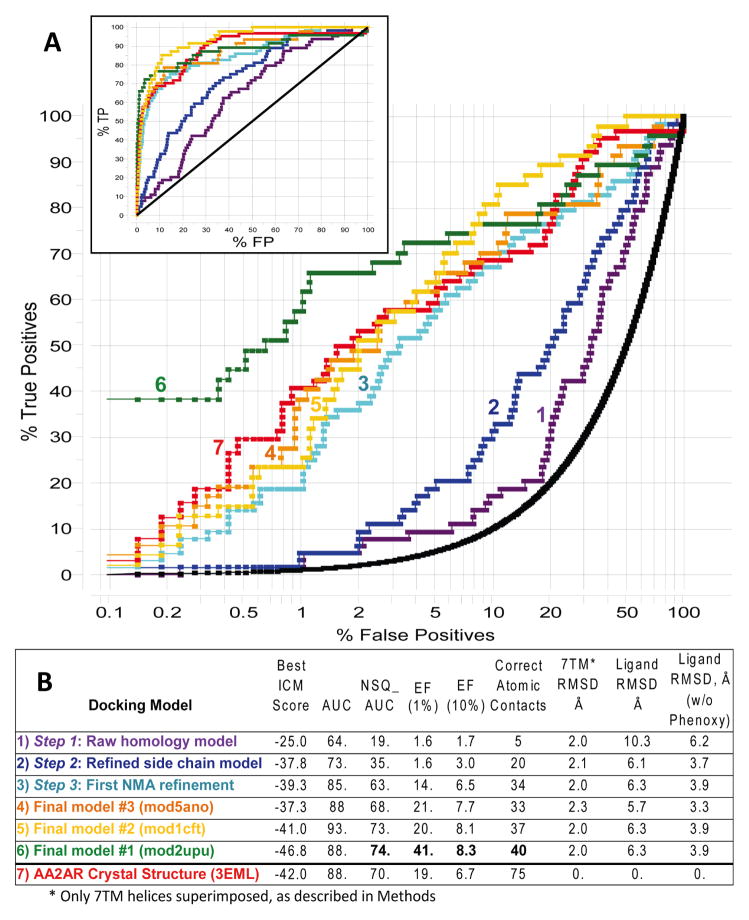
Figure 4.
Results of small-scale VLS evaluation for our AA2AR models at different stages of the optimization procedure, as well as for our three best models submitted to assessment. A. ROC curves for each of the models, shown in logarithmic scale to emphasize initial enrichment at 1% of the dataset (Insert shows a standard view of the ROC curves). B. The table listing key characteristics of the corresponding ROC curves and the overall quality of the model structures for the models as compared to the crystal structure (PDB code 3eml). The values of NSQ_AUC, enrichment factors and number of contacts are shown in bold for our rank#1 model.

