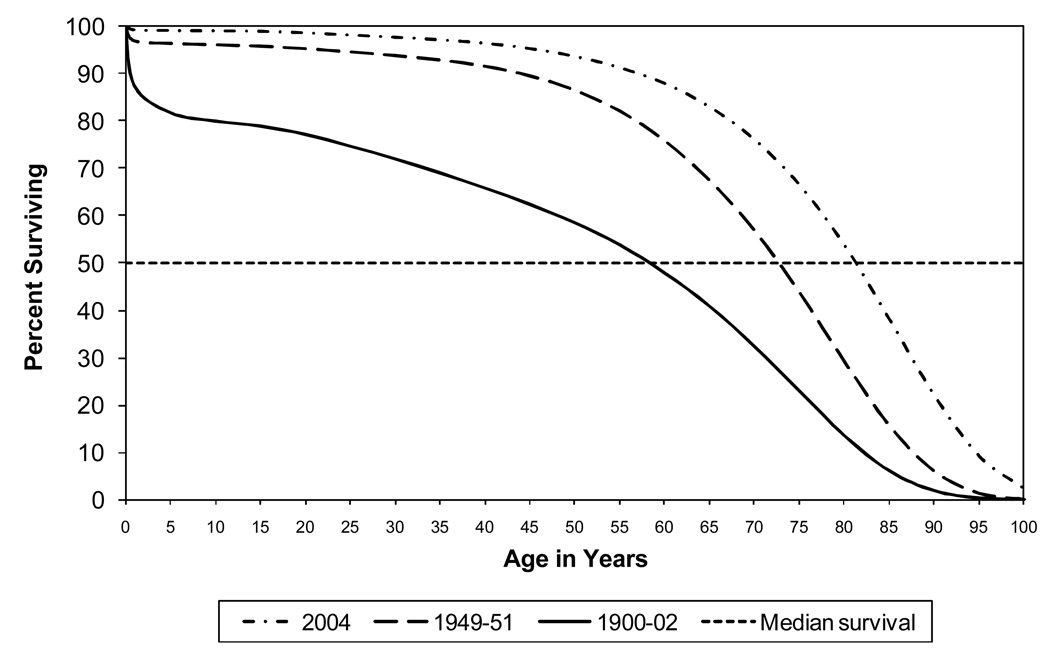
Figure 2. US Population Survival Curves, 1900–02, 1949–51, 2004.
Note: Median line represents half of the population has died and half remain alive, so point at which median line crosses each survival curve is the median survival time for that cohort. Data for 1900–02 from death registration states only. Data from National Center for Health Statistics.

