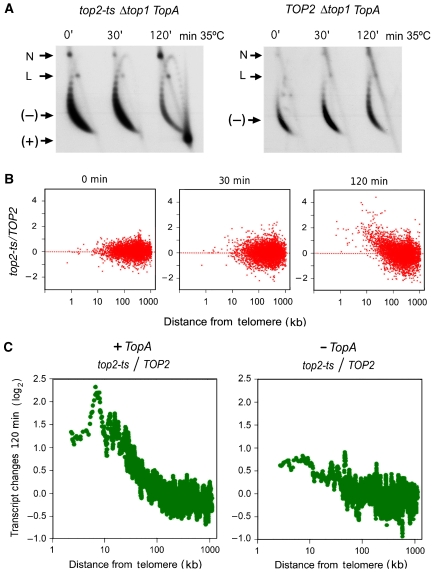
Figure 1.
DNA positive helical stress alters the yeast transcriptome according to the chromosomal position of the genes. (A) Two-dimensional agarose gel electrophoresis of DNA extracted from Δtop1 top2ts TopA (left) and Δtop1 TOP2 TopA (right) yeast strains after 0, 30, and 120 min of heat inactivation (35°C) of topoisomerase II. The gel-blot shows the conformers of the 2μ circular minichromosome. (−), negatively supercoiled DNA circles; (+), positively supercoiled DNA circles; N, nicked DNA circles; L, linear DNA. (B) The variation of transcript levels (log2 ratio top2ts/TOP2) after 0, 30, and 120 min of topoisomerase II inactivation is plotted for all analysed genes against their distance (bp) from the telomere. (C) Comparison of the variation of transcript levels (log2 ratio top2ts/TOP2) after 120 min of topoisomerase II inactivation with (left) and without (right) the expression of the E. coli TopA gene. Both graphs show averaged values for genes situated to a similar distance from the telomere in all the S. cerevisiae chromosomal arms (each point averages 20 genes). Data were adjusted to obtain an average ratio of 1 for all genes analysed.

