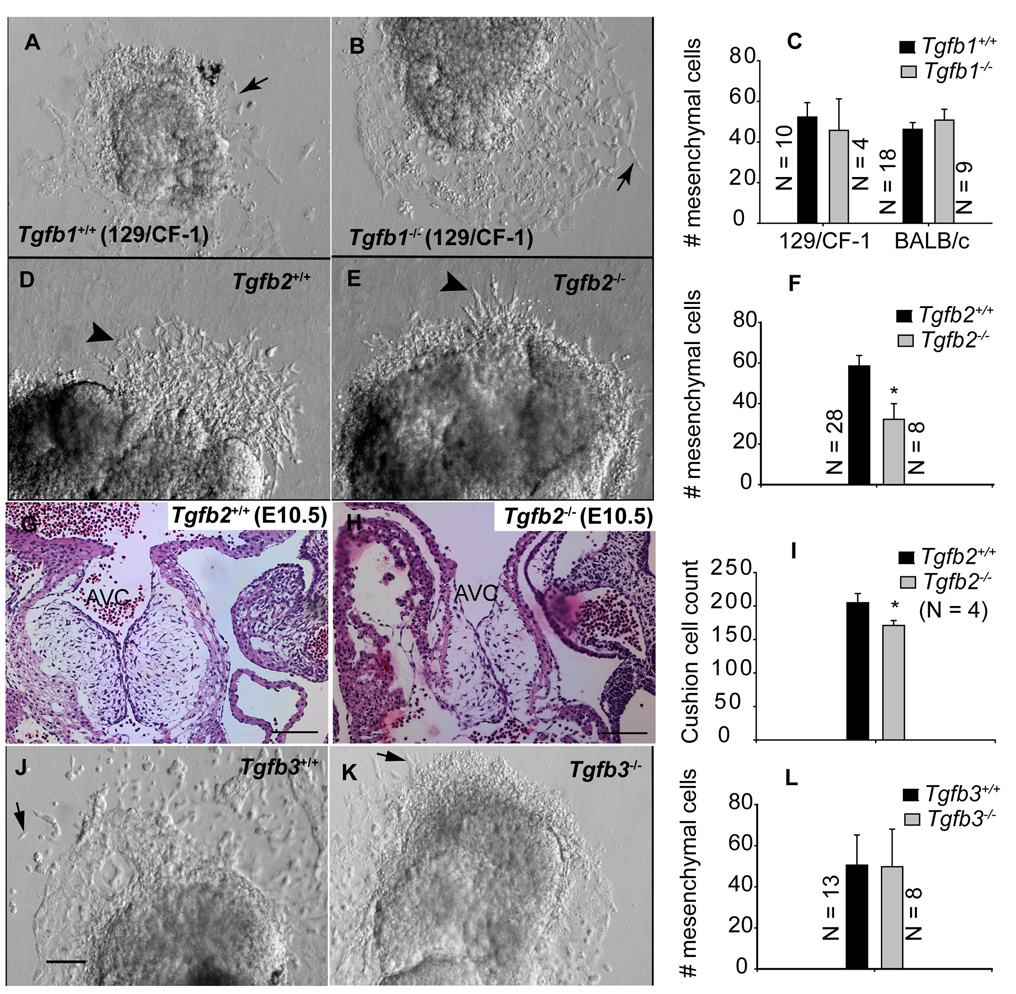
Fig.1. Effect of gene targeted disruption of Tgfb1, Tgfb2 and Tgfb3 on cushion EMT at an early stage.
Representative images of in vitro AV canal collagen gel assays (A,B,D,E,J,K) of Tgfb1+/+ (A) and Tgfb1−/− (B), Tgfb2+/+ (D) and Tgfb2−/− (E), and Tgfb3+/+ (J) and Tgfb3−/− (K) embryos at S21–29 (E9.5). Images were taken after 24 hr of explant culturing. Note that the number of mesenchymal cells present in the collagen gels cannot be determined with precision from the micrograph as many of the mesenchymal cells in our explant cultures were found beneath endothelial cells, and therefore they were not captured in the micrographs. C,F,L: Quantification of the number of mesenchymal cells (mean±s.e.m) below the gel surface (e.g., arrows (A,B,J,K) or arrowheads (A,B)). The number of mesenchymal cells is not significantly changed in Tgfb1−/− mice (C) (P=0.6640 for 129/CF-1, P= 0.4573 for BALB/c) or Tgfb3−/− mice (L) (P= 0.9737), but it is significantly reduced in Tgfb2−/− mice (F) (*P=0.0203). G-I: H-E stained images of showing AV cushions of E10.5 wild-type (G) and Tgfb2−/− mice (H) and the relative total cushion cell count in these embryos (I). The total cushion count is significantly reduced in Tgfb2−/− cushions (*P= 0.0201). Images are representative of 4 wild-type/mutant embryo pairs. Scale bar in (J ) applies to (A-B, D-E, J-K) = 100 µm; (G,H) = 100µm. AVC, AV cushions.

