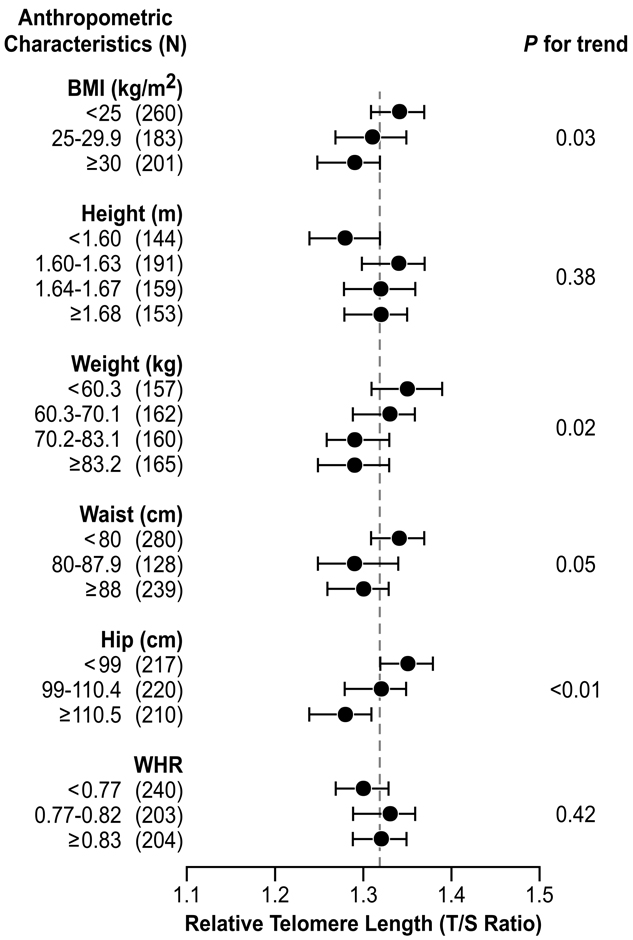
Figure 1.
Adjusted mean of relative telomere length (T/S ratio) according to anthropometric characteristics among 647 women aged 35–74 years in the Sister Study, 2003–2004.
Mean values (●) were adjusted for age, race, smoking status, perceived level of stress, regular use of NSAIDs, regular use of vitamin supplement, diagnosis of hypertension, and history of cardiovascular diseases. Bars represent 95% confidence intervals. A reference line ( ) indicates the overall mean of relative T/S ratio in the study sample.

