Figure 5.

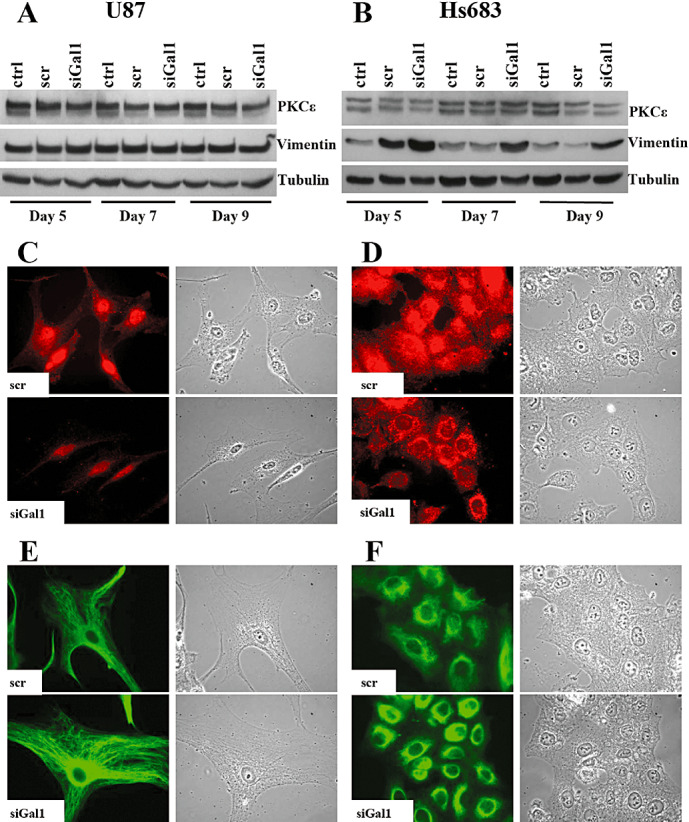
Western blot (WB) and immunofluorescence (IF) analysis of vimentin and protein kinase C epsilon (PKCε) protein expression levels; galectin‐1‐targeted siRNA increases only vimentin protein levels in Hs683, induces increased perinulear amassment of both PKCε and vimentin, and diminishes the diffuse cytoplasmic staining of PKCε. WB analysis of PKCε and vimentin protein expression levels in U87 (A) or Hs683 (B) cells untreated (ctrl), scramble‐transfected (scr) or galectin‐1 siRNA‐transfected (siGal1) at days 5, 7 and 9 post‐transfection. IF analysis of PKCε localization in U87 (C) or Hs683 (D) scr or siGal1 at either day 5 (Hs683) or day 7 (U87) post‐transfection. IF analysis of vimentin localization in U87 (E) or Hs683 (F) cells scr or galectin‐1 siRNA‐transfected (siGal1) at either day 5 (Hs683) or day 7 (U87) post‐transfection. In all IF figures right columns represent the corresponding bright field images.
