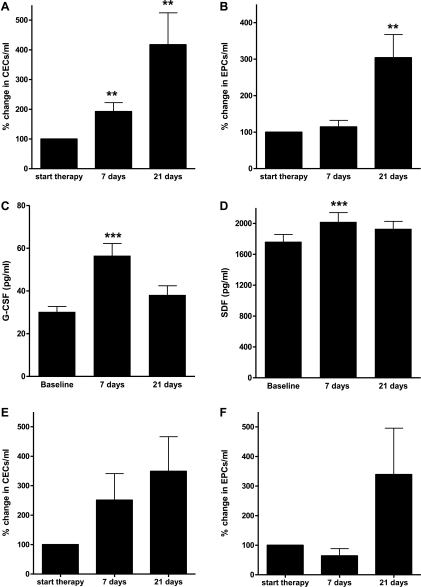
Figure 1.
Kinetics of CECs, EPCs, and growth factors during the first cycle of chemotherapy. Overall, a significant increase was seen in CECs (A), EPCs (B), G-CSF (C), and SDF-1α (D) (n = 71, P < .01). The increase in CECs (E) and EPCs (F) seems also present in patients treated with adjuvant chemotherapy (n = 9, P = .08 and P = .18).

