Figure 3.
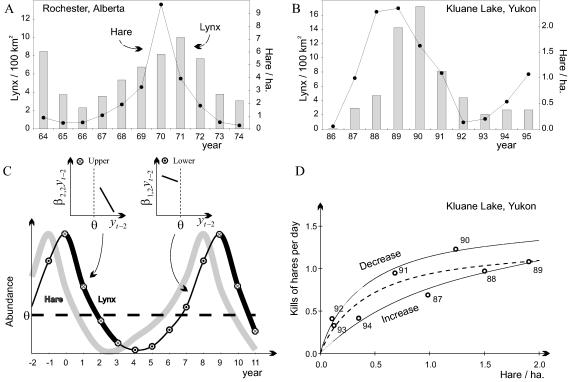
The pattern of fluctuation in the snowshoe hare (L. americanus Erxleben, 1777) and the Canadian lynx (L. canadensis Kerr, 1792) as recorded at Rochester, Alberta, from 1964 to 1974 (7–9) (A) and as recorded at Kluane Lake, Yukon, from 1986 to 1995 (10–13) (B). (C) The idealized pattern from the data in A and B with a schematic depiction of the phase dependency in β2,2yt−2 (see text) resulting from the predator–prey interaction. (D) The functional response curve of lynx feeding on snowshoe hares for Kluane Lake from O’Donoghue (60) and O’Donoghue et al. (66). Increase years (1987, 1988, 1989, and 1994) have a different functional response than decrease years (1990, 1991, 1992, and 1993), thus explaining the phase dependency in this system: the log likelihood increases by 9.19 when fitting two curves as compared with one common curve (the critical value being 3.00, i.e., 0.5*χ20.95(2); see ref. 67). The common model for the functional response curve {kill rate = s [hare density]/[1 + h (hare density)]} is given by the parameters s = 3.11 (±0.28) and h = 2.35 (±0.29) (RSS = 0.1937; 6 d.f.); for the decrease phase, the corresponding estimates are 3.92 (±0.38) and 2.47 (±0.36) (RSS = 0.01218; 2 d.f.) and, for the increase phase, they are 1.26 (±0.16) and 0.66 (±0.16) (RSS = 0.0073; 2 d.f.).

