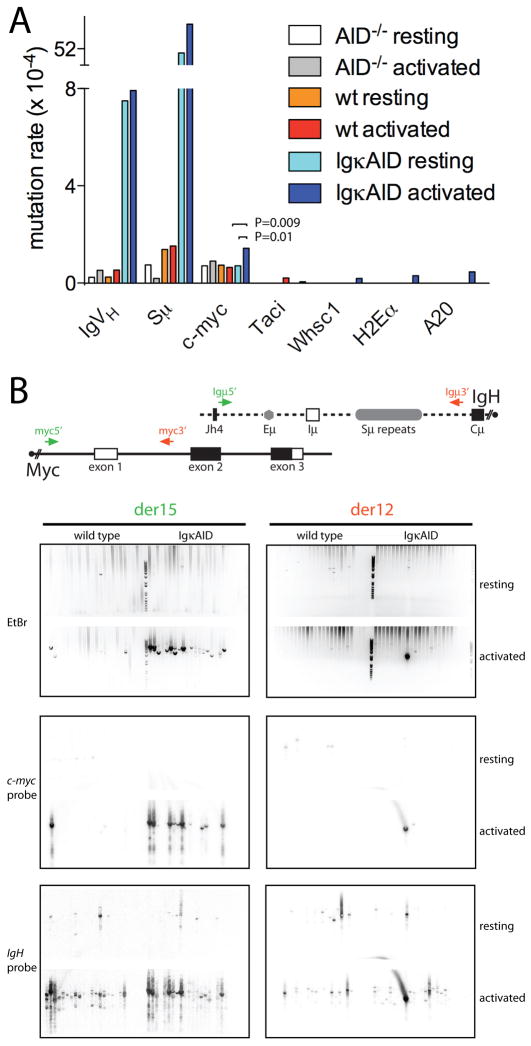
Figure 2. Somatic mutations and c-myc/IgH translocations.
(A) Frequency of somatic mutations in indicated loci of resting and LPS and IL-4 stimulated B cells. (B) C-myc/IgH translocations in resting B cells or B cells activated with LPS and IL-4 for four days. Top: Schematic representation of the Myc and IgH alleles with the PCR primers for detecting der15 and der12 c-myc/IgH translocations. Bottom: ethidium bromide (EtBr) stained gel with PCR bands indicative of translocations was blotted and probed for c-myc and IgH, as indicated, to verify translocations. Translocation frequency: wild type 0.4×10⁻⁶ (der15) and 0.1×10⁻⁶ (der12); IgκAID 4.6×10⁻⁶ (der15) and 1.3×10⁻⁶ (der12). One of two independent experiments is shown.

