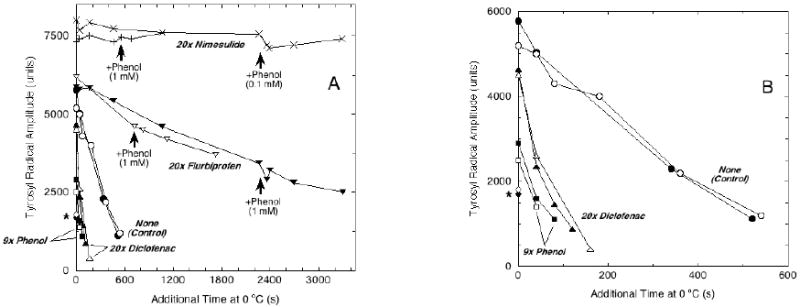
Figure 3.

Effects of COX inhibitors and reducing cosubstrate on PGHS-2 tyrosyl radical decay kinetics. Panel A: Peak-to-trough amplitudes of the g = 2 EPR signals from samples from the experiment in Fig. 2 are plotted as a function of the cumulative length of incubation at 0 °C after acquisition of the initial spectrum. Quantitation of radical intensity by double integration of the initial control samples indicated that an amplitude of 7500 arbitrary units corresponded to ~ 0.15 spins/heme. Two samples were run for each inhibitor. Extra phenol was added to the nimesulide and flurbiprofen samples at the times indicated by arrows. The time scale is expanded in panel B to show details from early time points. The asterisk indicates the data points from the two PGHS-2 samples reacted with nimesulide before EtOOH.
